


Waiting on your tax return? Read this!
Your Guide to America's Finances and the Financial Report of the U.S. Government

In Civics this Week: It’s Tax Season!
Tax season can feel like a drag each year as we move into spring. But it’s always important to stay informed on government spending - especially in unprecedented times when spending updates pepper news headlines on almost a daily basis. In the last week, for example, President Biden used drawdown authority to contribute $350 million in military aid for Ukraine from the Foreign Assistance Act. Biden is also waiting on Congressional authorization of $10 billion in additional assistance for Ukraine.
Understanding fiscal policy is not necessarily straightforward, but there are two essential government information resources that can make this challenge less daunting.
The Financial Report of the United States Government
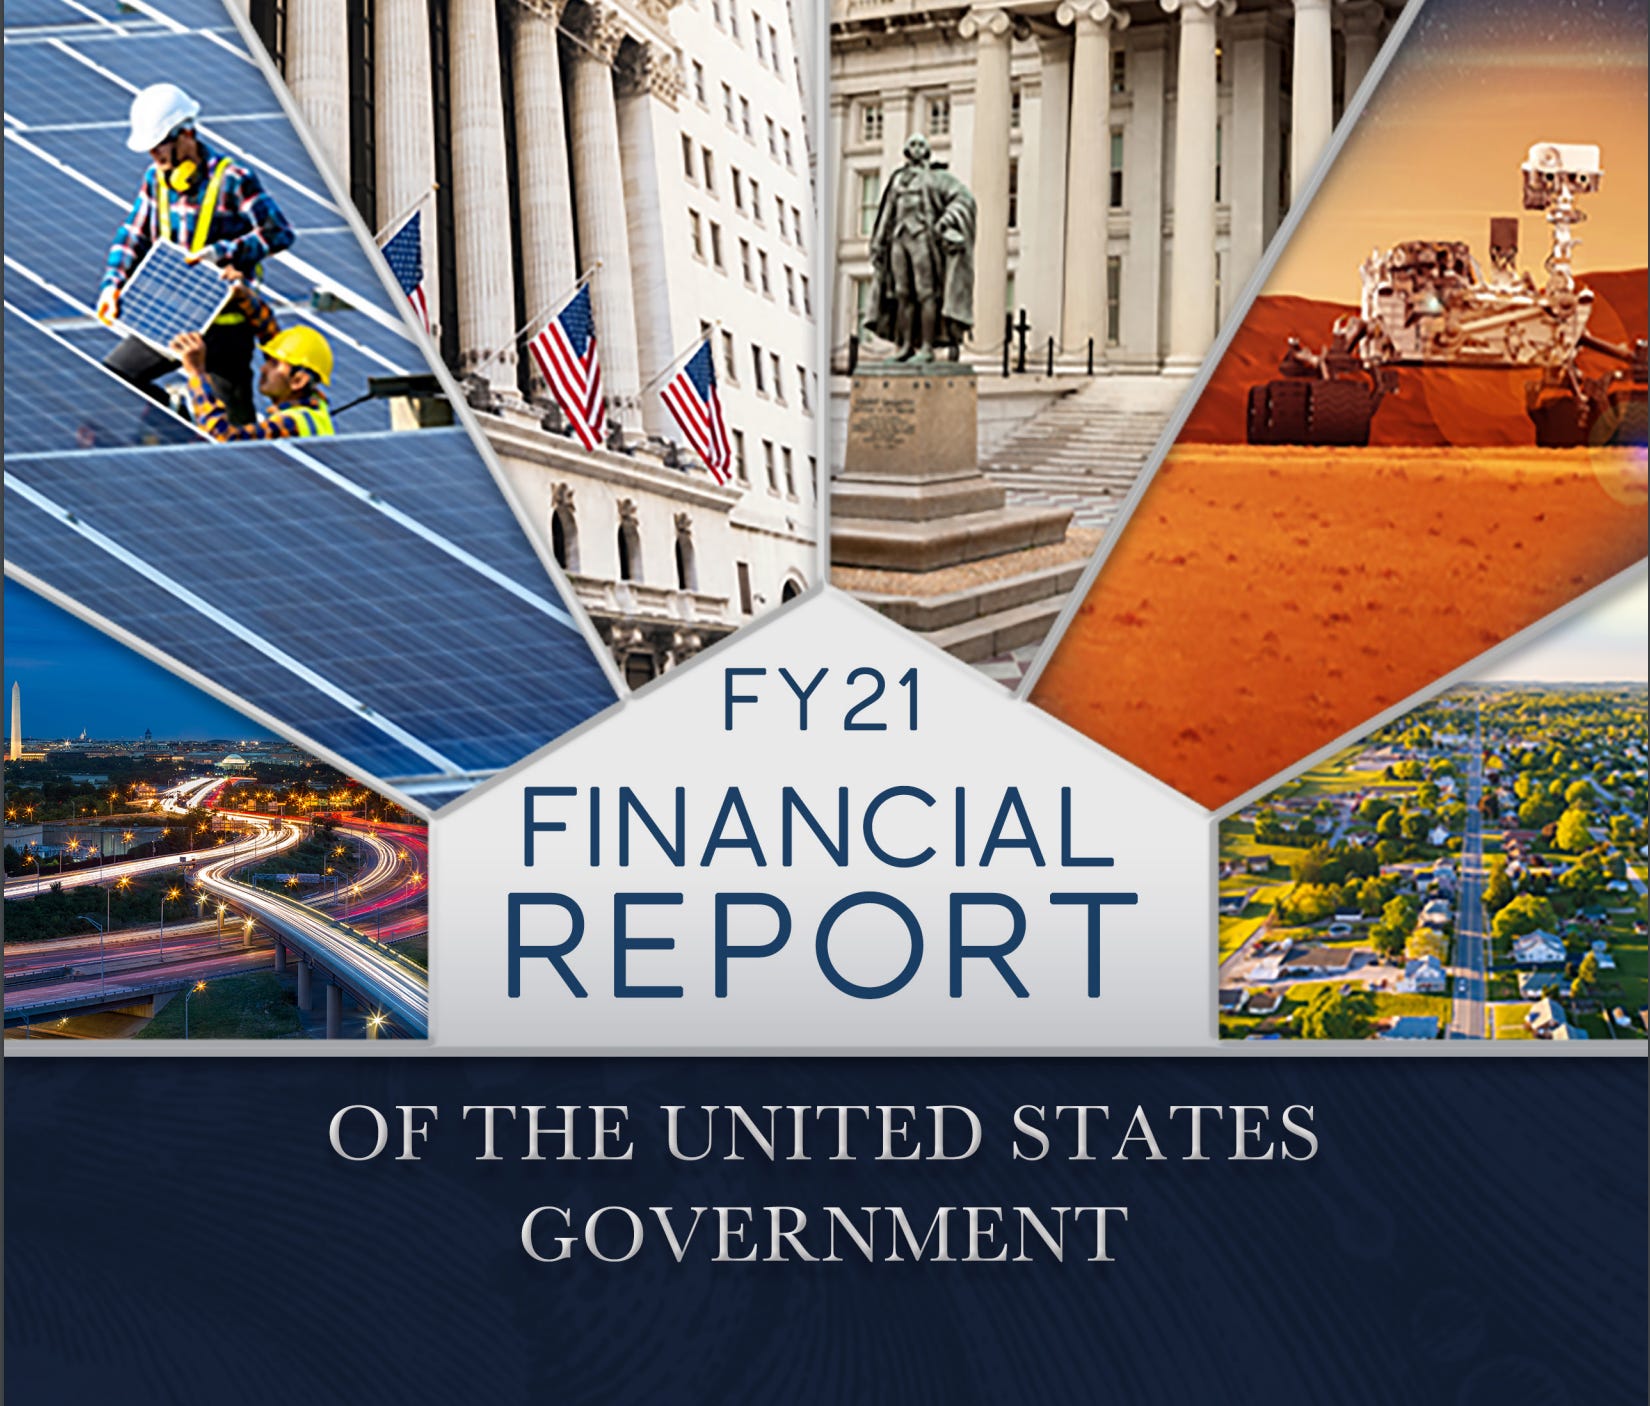
Every year, the Bureau of the Fiscal Service releases the Financial Report of the United States Government. This is a major report that is published with the purpose of informing the public on current fiscal policy and sustainable policy reforms. The fiscal year 2021 report was recently published on February 17.
The report in question is nearly 300 pages long. Though I am impressed by anyone who manages to read the whole thing, I assume that it’s not realistic for most of us to get through all of that. I recommend reading the Executive Summary, which is only about 12 pages. From there, you can use the table of contents to pick and choose other portions that look interesting.
Still feeling a little bogged down by the details? That’s where the second resource comes into play:
America’s Finance Guide (Data Lab, Bureau of Fiscal Service)

Operated by Fiscal Service in partnership with usaspending.gov and fiscaldata.treasury.gov (two other very useful websites on this topic, but more geared towards accessing large data sets for analysis), this website provides visual snapshots of data regarding federal revenue, spending, deficit, and debt from the official financial report. The site is highly interactive and explains important concepts in plain language. It’s not going to give you every last detail, but you’ll get the big picture.
As an example, here’s an interactive visualization for federal revenue sources. You can click on a section for more information - here, I clicked on the individual income taxes section for a further breakdown of that revenue stream.

In addition to the finance guide, the homepage links to other analyses that relate to federal spending and answer common questions:

You can also get a quick snapshot of daily statements from the U.S. Treasury on the homepage:
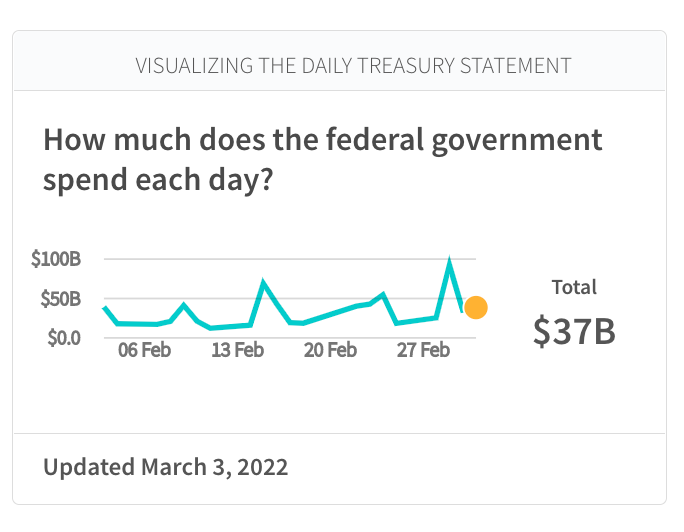
This is a nice addition to the website because while most data you’ll look at is from the previous fiscal year, this statement is updated to current spending every day that the federal government is open.
In Conclusion
Tax season is the perfect opportunity to brush up on the basics of federal finances and learn more about where your tax money goes. Referencing both a written report and data visuals fosters a more holistic understanding of the big picture. It’s also a great refresher course on how government finances work.
Did you enjoy these resources? Learn anything new? Let me know in the comments!
See you next week.